Promotion Mix Modelling
Promotional mix modelling for CPG manufacturers informs brand strategy to maximize promotional ROI, increase market share, and drive sustained revenue growth by allocating promotional budget towards most effective channels

Contents
- Introduction
- Business Problem
- Data Analysis
- Data Science Solution
- Business Adoption and Impact
Introduction
Today brand teams have many different channels and tactics at their disposal for building brand equity and boosting sales. However, with the increasing complexity of the promotional landscape it becomes critical to make data-driven decisions about how much to invest in each channel.
Promotional Mix Modeling (PMM) is a technique to quantify the impact of advertising and promotional activity on the sales of a brand while controlling for other factors such as product price, distribution, category growth, and competition. PMM informs marketing strategy and tactics by helping brand teams understand the effectiveness of each marketing channel such as advertising, in-store, direct-to-customer (DTC), digital and social media.
Some of the business benefits of PMM are:
- Better understanding of the relative performance of various promotional channels
- Simulation of “what-if” scenarios
- Optimization of the promotional mix to maximize revenue/profit
- Optimization to attain a revenue target with minimum increase in promotional investment
PMM is widely used in CPG, Retail, Healthcare, Travel & Hospitality, and Retail Banking.
Business Problem
Client is a CPG manufacturer with a portfolio of leading beverage brands. To promote their Target Brand, Client spends $10+ MM each year allocated across diverse promotional channels such as In-store, TV Ad, Print Ad, Paid Search, and Social Media.
Client needs to measure the Return on Investment (ROI) on each channel to understand which promotions are more effective in driving sales.
Data Analysis
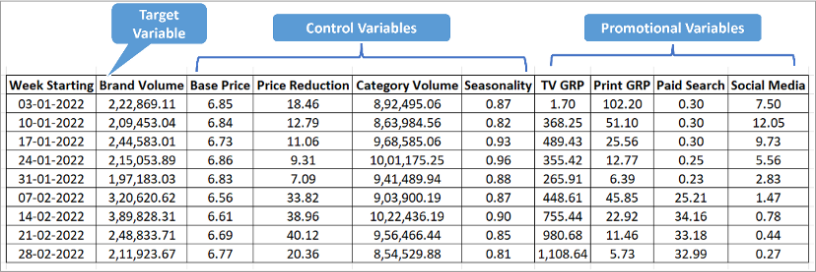
Business data for brand sales, pricing, promotional investment etc. was extracted on a weekly basis for 3 years. A longitudinal dataset was stitched together comprising of sales, promotions, and control variables
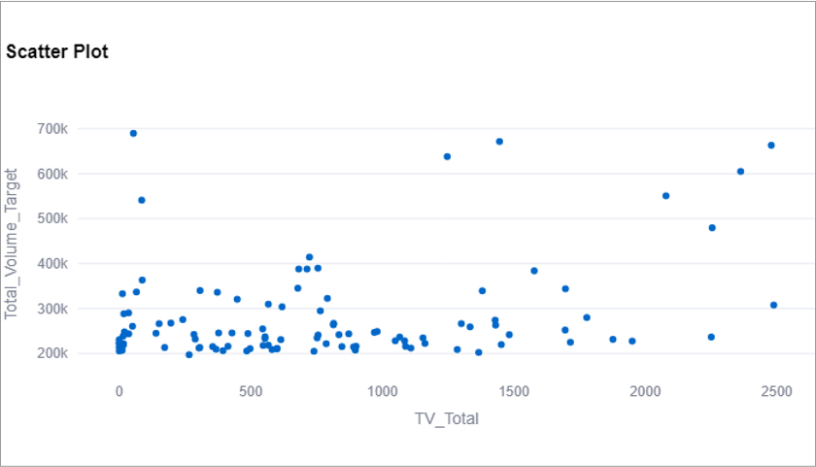
A comprehensive data exploration was performed within the MLAutomata platform to understand the distribution of key data variables, identify outliers, detect collinearity etc.
Data Science Solution
The Regression module within the MLAutomata platform was used to model the relationship between brand sales and promotions such as Television and Print Advertising, Digital Paid Search and Social Media. Variables representing brand price, in-store promotions, seasonality etc. were included in the model as controls. A Multivariate Regression model was used to estimate the impacts. Finally, ROI (return on investment) for each channel by applying brand margin, promotional investment and other financial parameters.
Feature Engineering
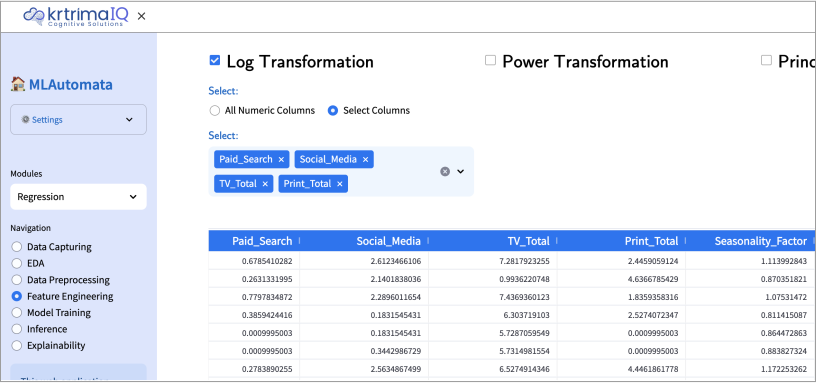
To account for certain business assumptions, a set of transformations were applied to the key promotional variables which are mentioned below.
Retention or Carryover
We assume a lag between a consumer’s exposure to a promotion and their purchase decision. This assumption is mathematically captured using the Adstock transformation which assumes that the effect of a promotion on sales is spread over time (hence “carryover”) but decays exponentially. The rate at which the decay occurs can be parametrically adjusted. For instance, TV and print advertising are assumed to have a slower decay than Digital and Social Media promotions.
Diminishing Returns or Saturation
All promotional activity is assumed to have a positive but diminishing impact on sales where a constant increase in the level of promotion will lead to a less than proportional increase in sales. This implies a non-linear association between sales and promotion. There are various mathematical functions which model such relationships, one of the simplest and most intuitive being the logarithmic transformation.
Regression Modeling
A Multivariate Regression model has been used to estimate the per unit increase in Sales (“Total Volume”) of features representing promotional channels such as Print Media, Paid Search, Social Media and TV advertising. Additional variables representing control factors were also retained in the model when statistically significant.
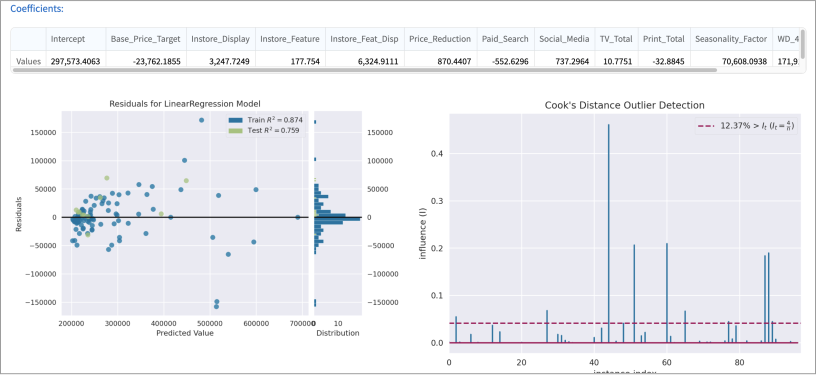
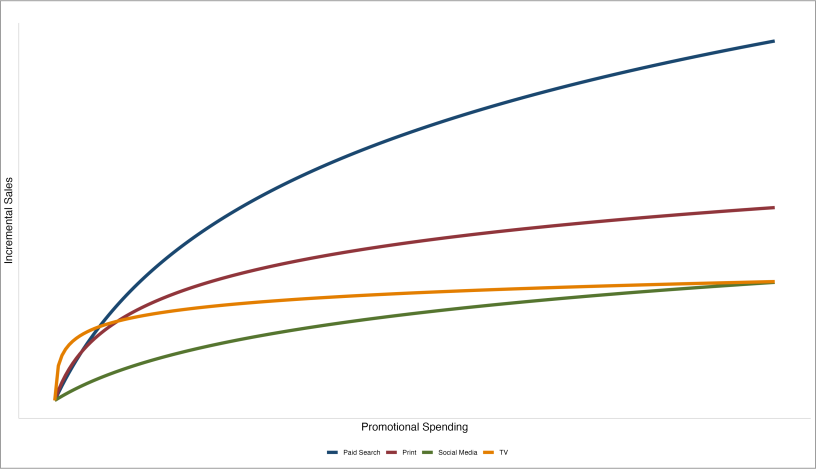
Co-efficient from the model output for the four promotions are used to plot the response curves to understand the impact of these promotions on sales.
Technologies Used :
MLAutomata
Business Adoption and Impact
Response Curves
Response curves depict the sales response to a promotional channel as the level of promotional activity is increased from zero to arbitrarily high levels (ex. 3x of historical level). A response curve which has a “flattened out” appearance indicates a high level of saturation in the sales response to promotion (ex. TV advertising). On the other hand, a response curve which has an almost straight-line trajectory implies historical levels of activity that are far from saturation (ex. Paid Search).
Return on Investment (ROI)
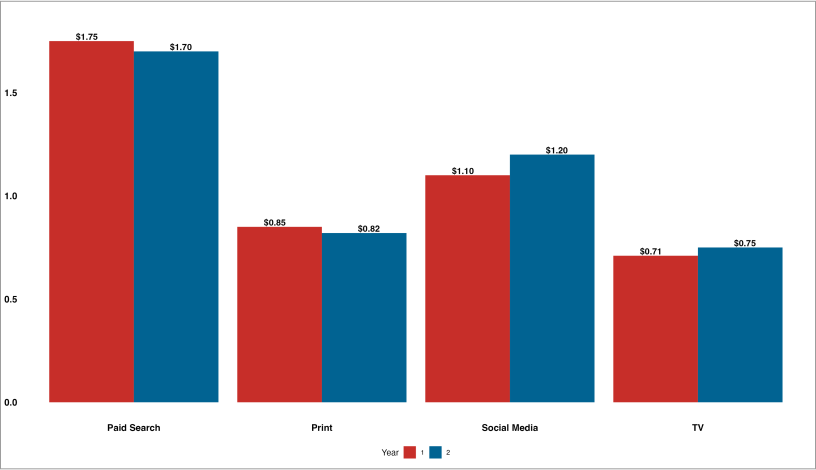
ROI measures the increase in the brand’s dollar revenue for every $1 spent on a given promotional channel or tactic. It is a critical metric for decisions around how to redistribution the brand’s total promotional budget among various channels to achieve business goals such as maximizing revenue or limiting promotional expense without impacting sales.
• Digital and Social Media were estimated to have better than “break-even” average ROI while traditional advertising channels had lower ROIs
• Based on the findings, brand team decided to reallocate promotional budget away from TV and Print Ad towards Paid Search and Social Media
Volume Contributions
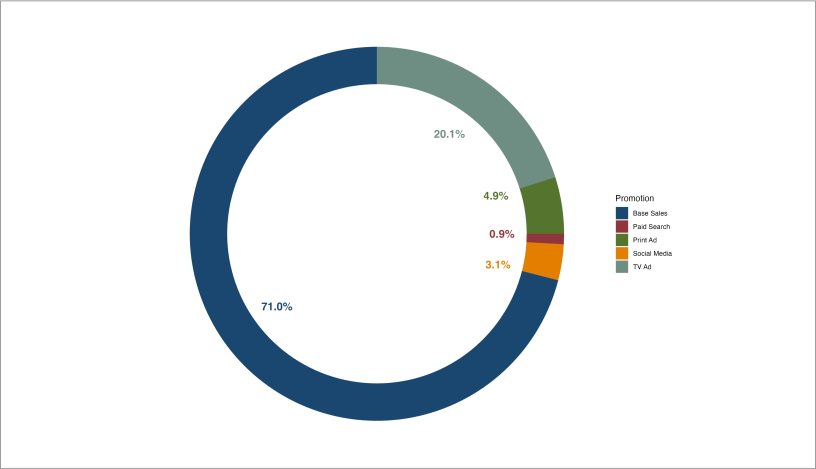
Volume contributions inform the brand about which promotional channels are responsible for driving the most sales. Note that a brand could have a high sales contribution (ex. TV Ad at 20%) while having a relatively low ROI (or vice versa) if the investment in that channel was high.

Contact Us
Your response has been saved. Thank you.
We will reach out to you shortly.

Read More
See the latest of our technologies in our blog section.
The Hidden Costs of LLM APIs That Per-Token Pricing Doesn’t Tell You
This article is part of a series on buildi ...
How We Unified Three LLM Providers Behind One Interface
This article is part of a series on buildi ...
Your LLM Prompt Won’t Save You From This
This article is part of a series on buildi ...

© 2026 krtrimaIQ Cognitive Solutions. All Rights Reserved
Email: info@krtrimaiq.ai