Deployment of Credit Card fraud Detection algorithms for a bank based in Nigeria
Automation for Fraud Detection for a Bank
MLAutomata
Contents
  • Objective
  • Solution
  • Data Analysis
  • Feature Engineering
  • Model and Results
  • Explainability
  • Conclusion
For Financial Fraud Solutions

Objective

Client's existing suite of solutions are based on traditional rules engine that raise alarms, which need to be investigated further manually. The more alerts raised, higher the effort to investigate and conclude. Client wanted to enhance these solutions to reduce false positives and also compliment rules engine with machine learning models that could detect and prevent credit card related frauds in a bank with higher accuracy.
False Positive Reduction (FPR) runs independently outside the Rules Engine application. The main aim of this model is to reduce the number of false positives generated from the Rules Engine model. The output from the Rules Engine application is feed into FPR model to further classify them to real frauds and false positives.

Solution

A comprehensive solution to detect and prevent credit card frauds in the bank. The solution includes exploratory data analysis, statistical analysis, classification and anomaly detection techniques to reduce false positives and detect fraudulent transactions with higher accuracy.
We have used our proprietary MLAutomata platform to develop, train and evaluate various models. After technical and business validation of models, chosen model has been deployed to production.
Technologies Used :
MLAutomata

Data Analysis

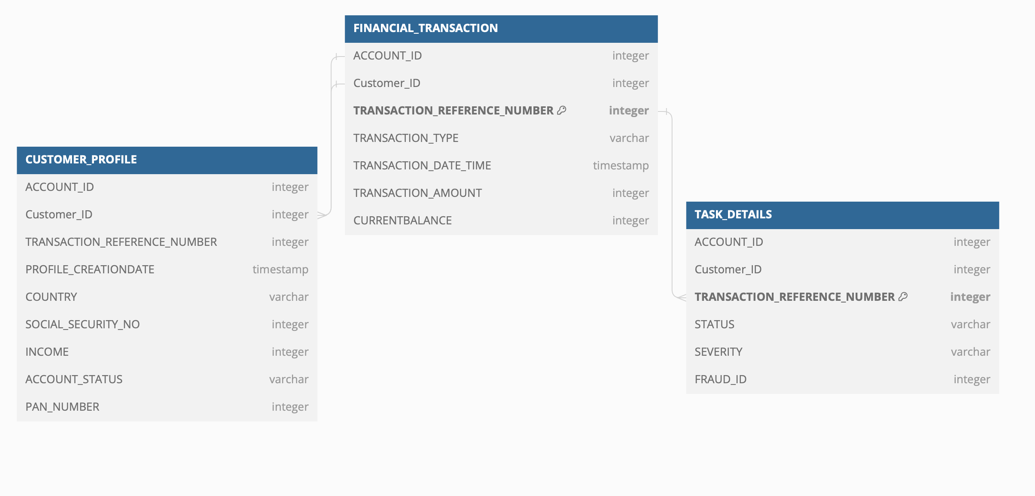
Data was collected from multiple data sources and the sample entity-relationship diagram is provided below, The target variable status is the binary variables and this is generated by the rules engine as alerts.
Client has provided 3,65,106 alerts generated by existing Rules Engine, which had been manually inspected and classified in to 48,498 as real fraudulent transactions and remaining 3,16,608 as non-frauds. The dataset contained several customer and transactional level information such as Account balance, location, type and amount of transactions etc. Based on the data analysis, EDA and experts advise we have done some data processing before importing it to MLAutomata. The target column is the status of the transaction as fraud or non-fraud based on the manual inspection of each and individual transactions.
image
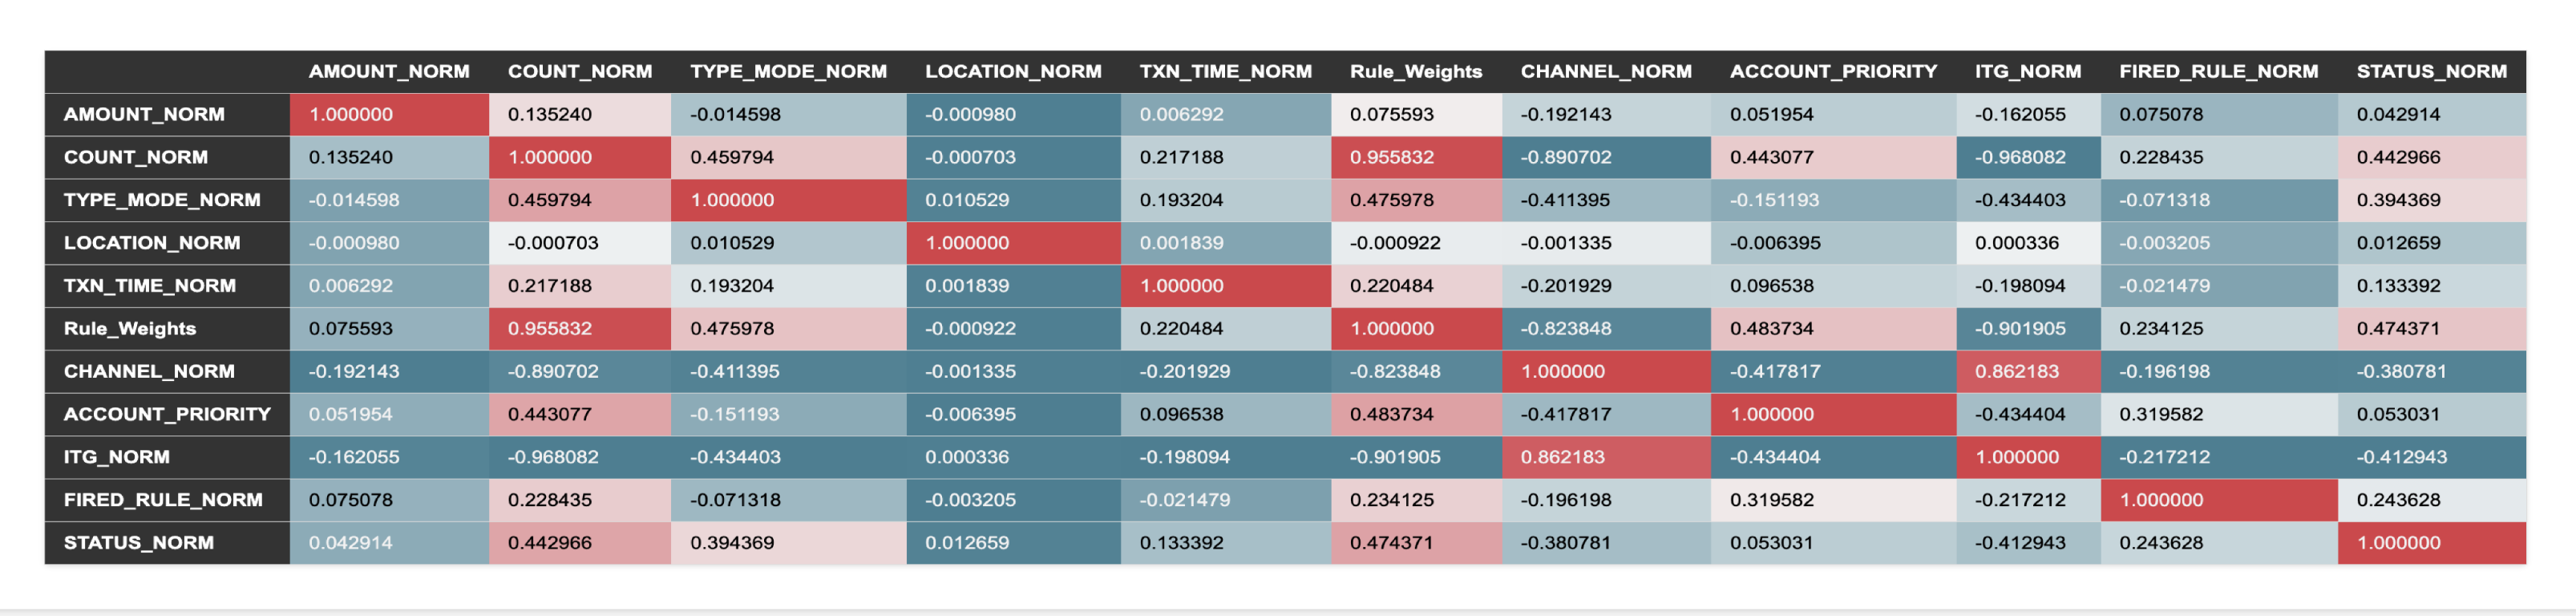
Correlation Matrix
image
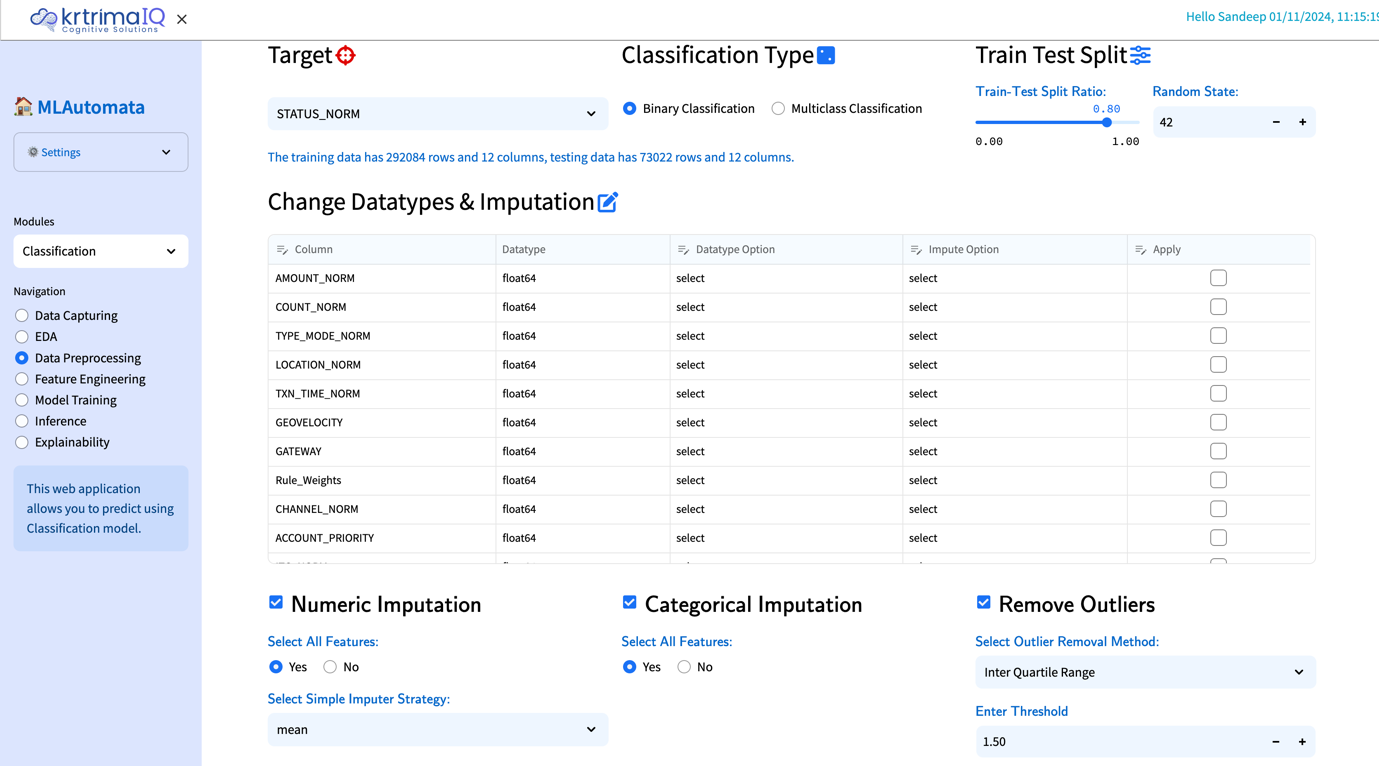
After Exploring the data we have decided to split it into (80/20) training and testing for the model building process.
image
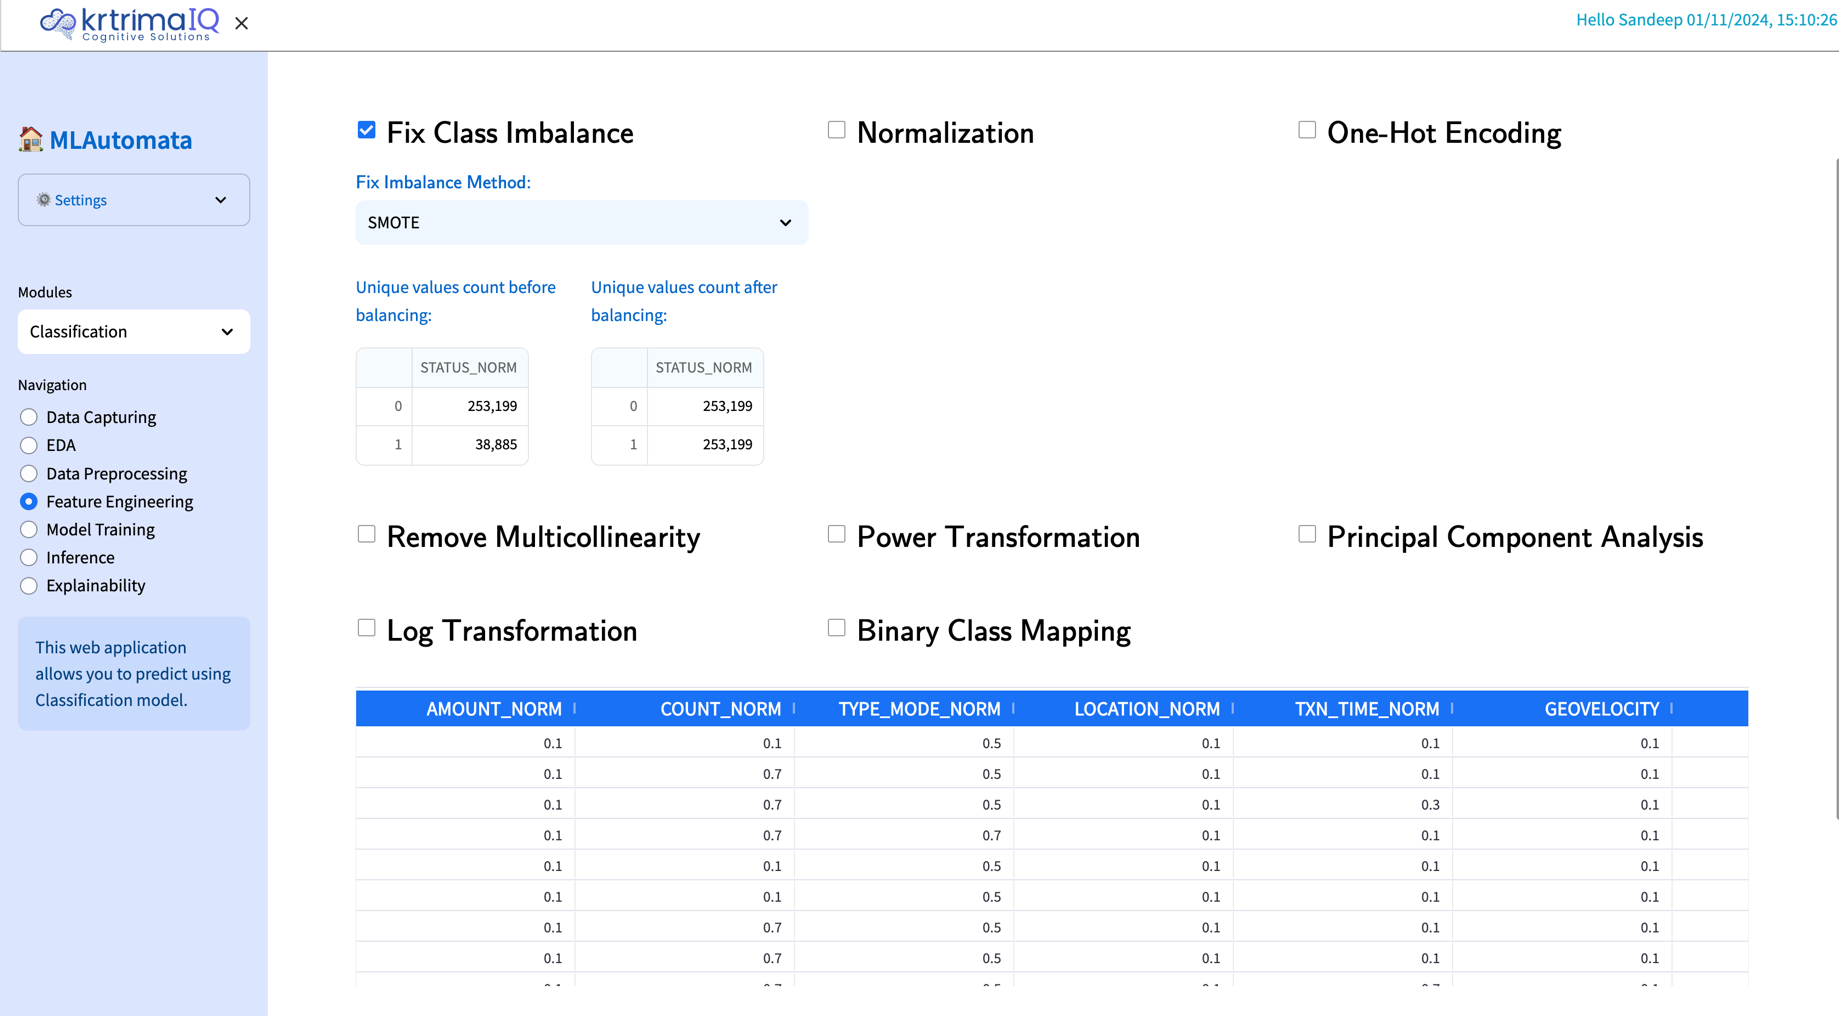
Because of the presence of class imbalance in the dataset we have performed SMOTE technique to upscale the number of cases in the minority class, which is fraudulent transactions, to match the non-fraudulent transactions.
image

Feature Engineering

The inputs to the FPR model is a mix of variables of each transaction as well as the profiles of the parties involved at a client / account / card level. Every pattern is built out of component features.
Sample features for card fraud detection can include variables such as the following:
  • Current Amount ticket size relative to previous averages for same card.
  • Known Merchant OR First time usage at this merchant.
  • Unusual region for current card. First time usage.
  • Unusual time of day relative to history of current card (never used before 5 AM)
Some features may not just be at individual transaction level but at a sequence level.
    Some examples of such features are given below:
    • Inter Transaction Gap (time between two transactions)
    • Previous transaction at compromised card / Pin Failure : Is this an unusual habit?

    Model and Results
    Multiple models have been trained and based on the F1 score we have selected random forest classifier model.
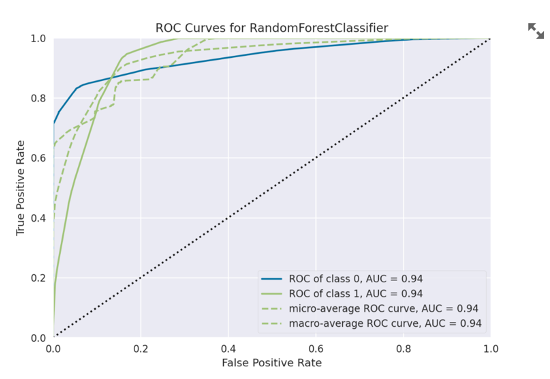
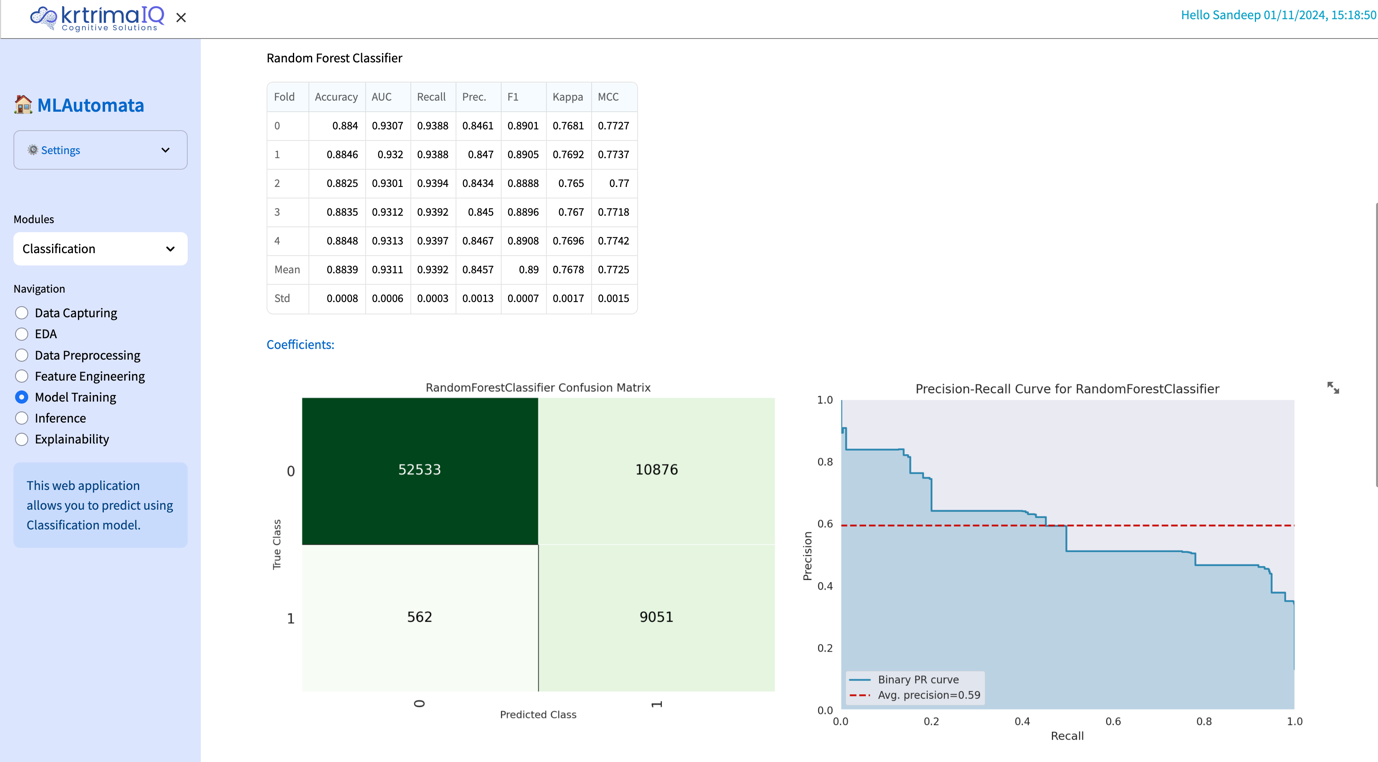
    We have trained a Random Forest Classifier to the dataset to find out the true positives and false positives with 5 cross validation sets, the results from the model is given below
    image
    The Mean F1 score from all the CV sets is 89%, and the recall and precision is 94% and 85% respectively.
    image

    Explainability

    From regulatory compliance and business ethics perspective, it is important that model classification of a specific transaction can be explained in business terms why the model classified it as a fraud or non-fraud.
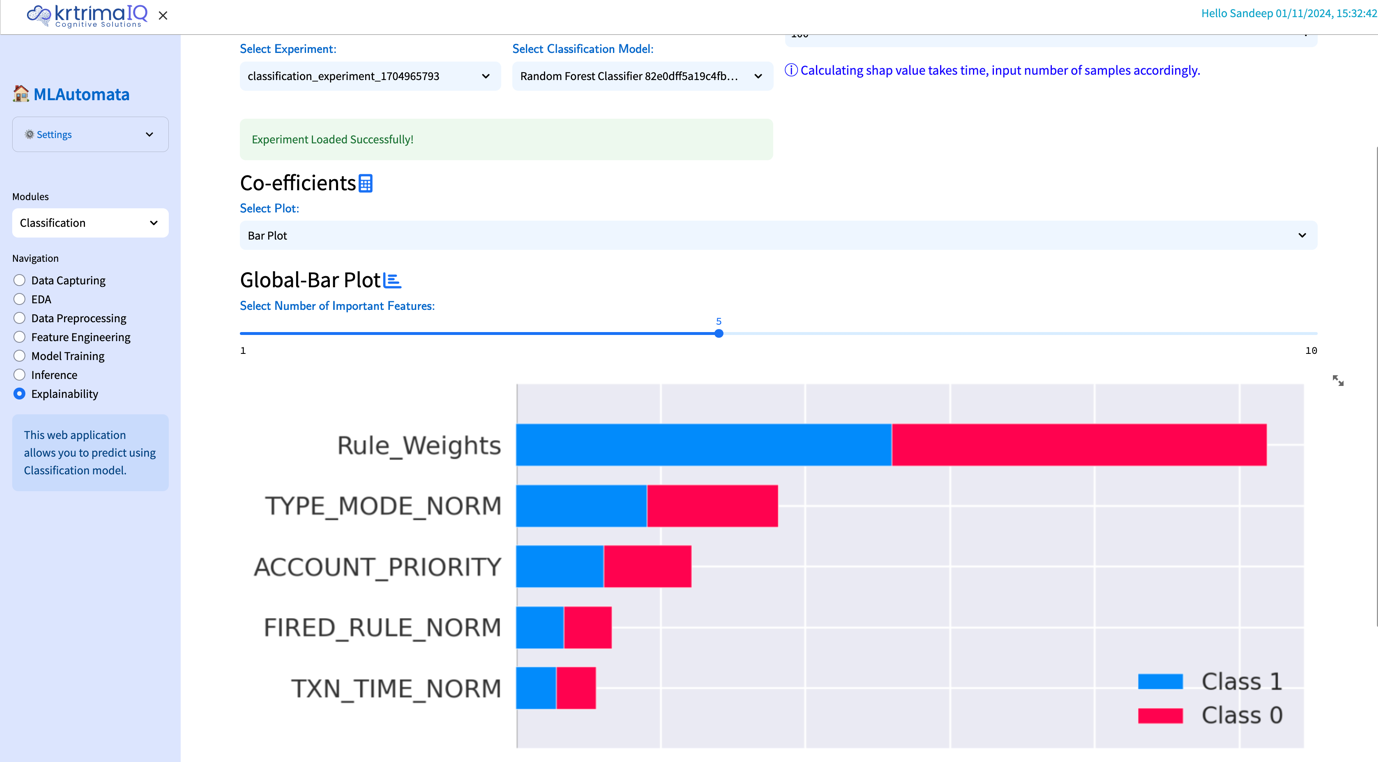
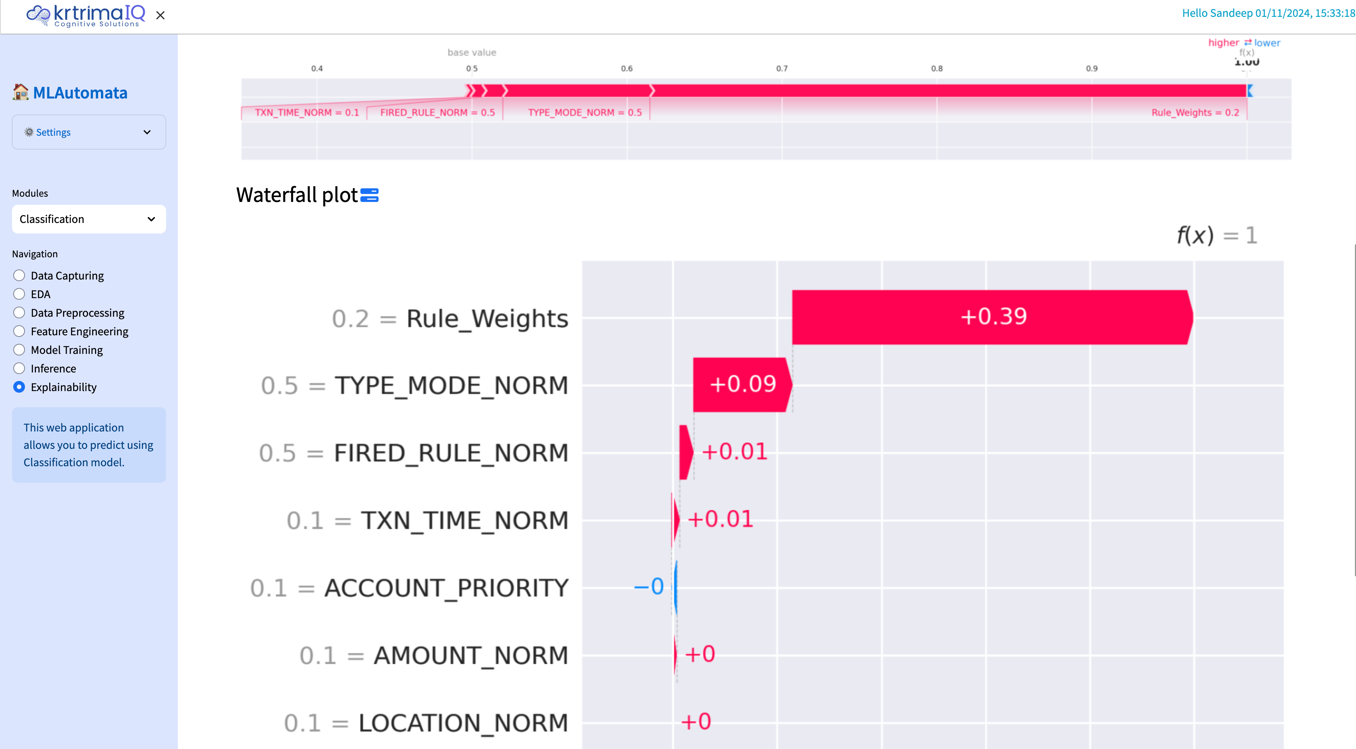
    Our model’s output can be explained using Shapely values for the entire dataset as well as on individual transactional levels.
    Here Features are ordered from the highest to the lowest effect on the predictions, X-axis contains the absolute effect of each features on the prediction, In the plot given above Rule_Weights had an high effect on predicting fraudulent or non-fraudulent case and these global plots explain the effect of each feature on the entire dataset.
    Individual transactions also can be explained by Shapely evalues, the plot given above is called the waterfall plot and it explains the cumulative effect of features on prediction. We can also see the deviation of the prediction from the average or the expected prediction given the information of all the features.
    These Explanations are very crucial in understanding the trends and patterns within the data and it can be used to understand how the ML model is classifying transactions as fraud or non-fraud.
    Global Explanations
    image
    Transaction Level Explanations
    image

    Conclusion

    Before building the FPR model, 100% of the Alerts from the rules engine had to be investigated manually to conclude whether it is a truly fraudulent transaction or false positive. After the FPR model implementation, number of false positives reduced by 73% and false negative rate reduced by 6%. This has significantly reduced the efforts of the investigators and reduced the probability of not catching true frauds.
    Explore More
    Predicting Diamond Cut Quality
    Predicting Diamond Cut Quality

    We built a smart computer program that can tell how well a diamond is cut just by looking at its features. It helps diamond companies make sure they're selling the best quality diamonds.

    Vehicle Insurance Fraud Detection
    Vehicle Insurance Fraud Detection

    Our Vehicle Insurance Fraud Analytics solution uses advanced machine learning algorithms to help you identify fraudulent claims and improve the overall risk management of your organization. Analyse historical insurance claims data, identify patterns and anomalies, and detect potential fraudulent claims with the help of our solution.

    Customer Propensity Model for Retail Bank
    Customer Propensity Model for Retail Bank

    Unlock customer insights and boost profits with our Customer Prosperity Model. Our data-driven solution empowers retail banks to enhance customer experience, optimize engagement strategies and grow revenue streams. Experience the power of predictive analytics and take your retail banking to new heights with krtrimaIQ.

    Medical Insurance Fraud Analytics
    Medical Insurance Fraud Analytics

    Leverage machine learning algorithms to identify fraudulent behaviour patterns and improve the accuracy of fraud detection. Save time and resources by automating the fraud investigation process and increase the overall security of your medical insurance business. Contact us to learn more about our advanced fraud detection solutions.


    Contact Us