Forecasting Power Consumption
Forecasting power consumption involves using historical consumption data and relevant factors to predict future electricity demand, enabling energy providers to optimize resource allocation and enhance grid reliability.

Contents
- Introduction
- Solution
- Data Analysis
- Model
- Explainability
- Conclusion
Introduction
This dataset provides hourly records of instantaneous power consumption for multiple clients.
Of an electric utility company. The data captures the electricity usage patterns of various customers in watts, allowing for insights into their energy consumption behaviour throughout the day. With these records, researchers and analysts can explore trends and make informed decisions related to energy distribution, demand forecasting, and more.
In this case study, we focus on Consumer MT_002, aiming to provide accurate predictions that enable proactive energy management and enhance customer satisfaction. We utilize advanced analytical techniques to forecast power consumption for individual consumers.
Solution
In this case study, we explore the application of regression models for multivariate time series forecasting. Specifically, we aim to forecast electricity consumption based on multiple variables such as month, hour and day of the week. By leveraging regression techniques, we can capture the complex relationships between these variables and predict future electricity demand accurately.
Technologies Used :
MLAutomata
Data Analysis
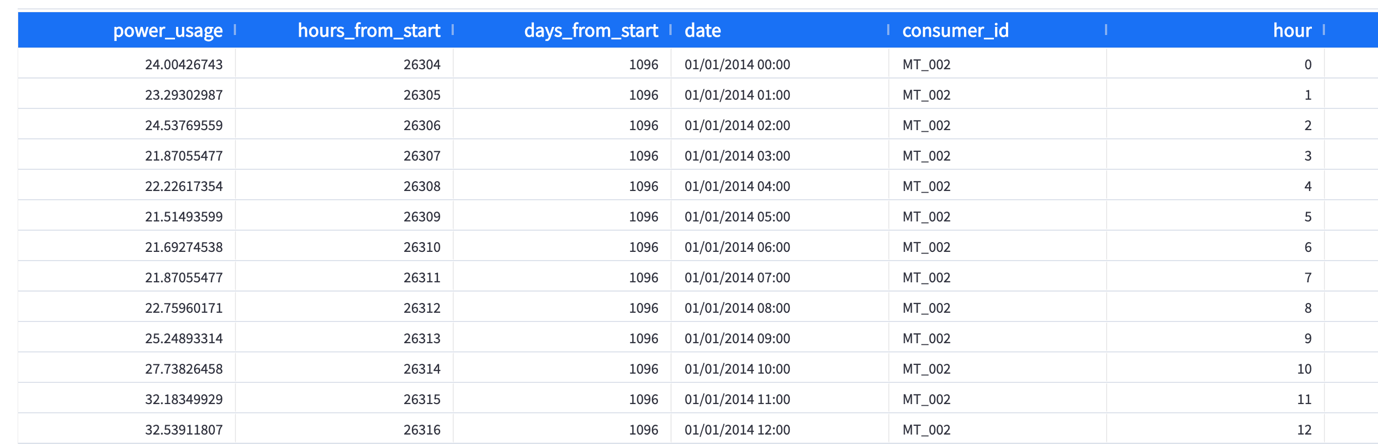
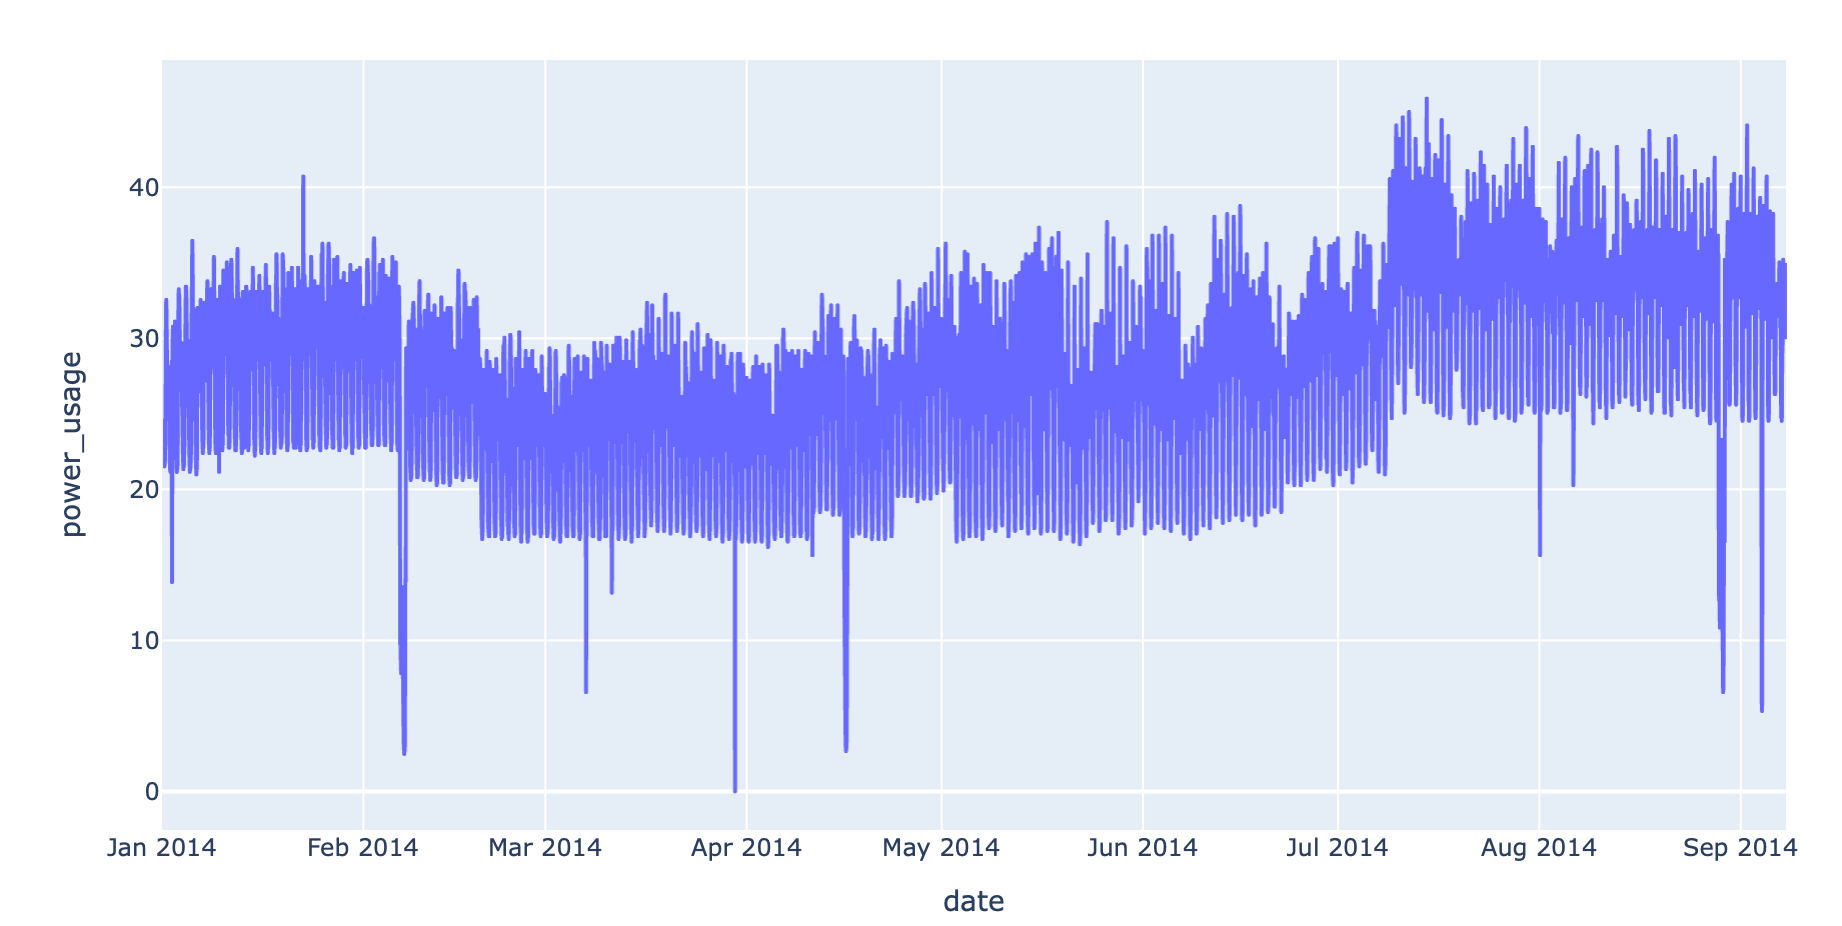
The dataset contains hourly power consumption of multiple clients. For the simplicity we are focusing on consumer MT_002. We have the power usage data of MT_002 from 1st January 2014 to 1st week of September 2014. Overall lit has 6000 datapoints.
The Series
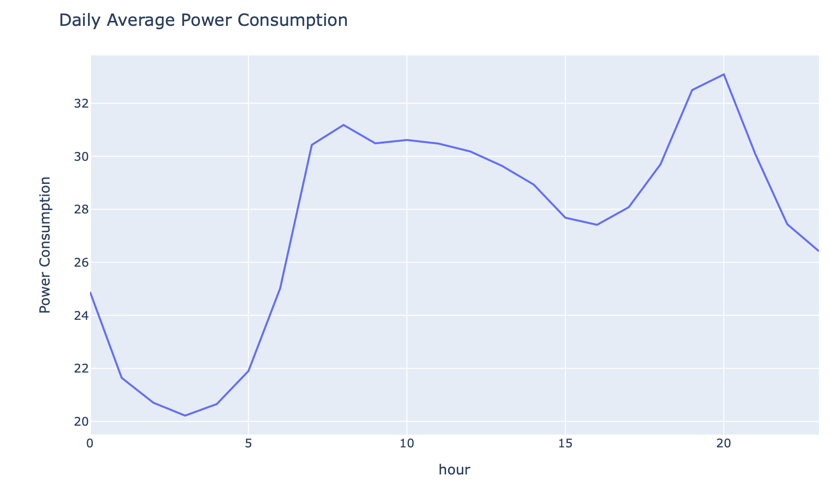
The power usage is very high from 3pm to 8pm on an average and it is minimum during midnight till 5pm. Also power usage is very high in the week ends and low on the week days and the pattern is consistent.
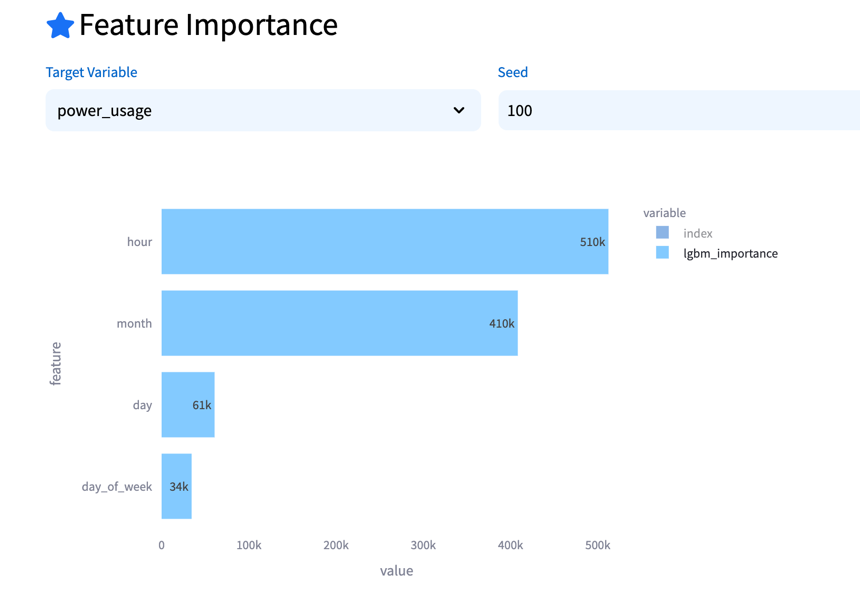
We have split date column into, hour, day, day_of_week and month columns. We are using these 4 columns to predict the power usages. Among these four predictors hour had high correlation with power usage and is the important feature in predicting power usage over the period.
Split the dataset into 80-20 training and testing sets before modelling, 20% of the data has been kept to evaluate the model performance.
Model
We experiment with various forecasting models, ranging from traditional statistical methods like ARIMA and SARIMA to machine learning algorithms such as Random Forests and Gradient Boosting. Models are trained using the training dataset, with hyperparameters tuned through cross-validation to optimize performance.
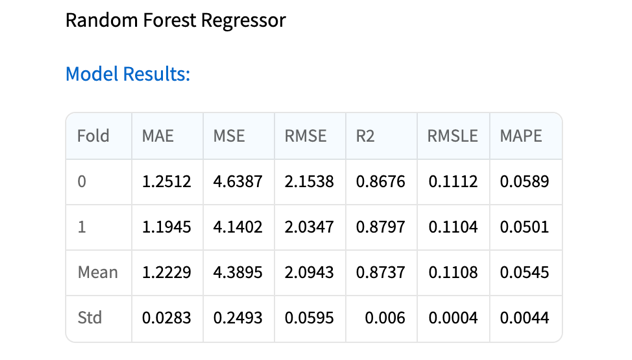
The performance of each model is evaluated using appropriate metrics such as R squared, Mean Absolute Error (MAE), Mean Squared Error (MSE), and Root Mean Squared Error (RMSE). Additionally, we assess the models ability to capture seasonality, handle outliers, and generalize to unseen data using validation datasets.
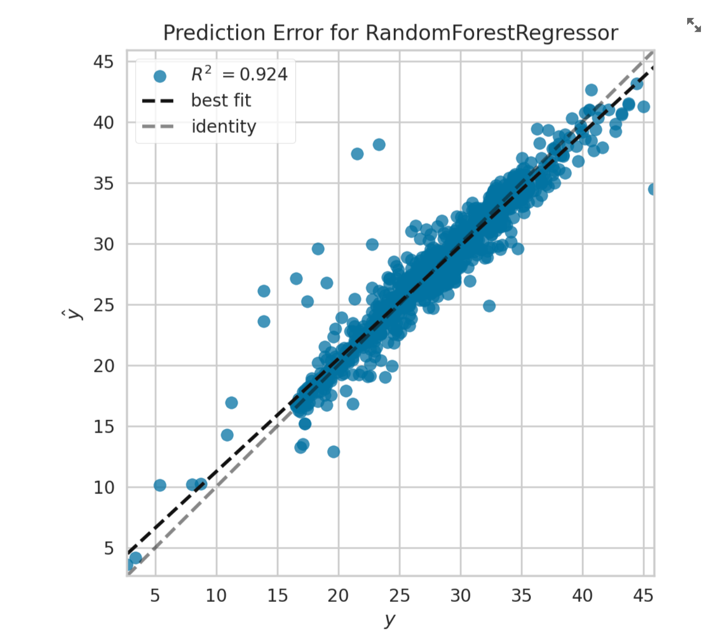
Once trained, the selected model is used to generate forecasts of electric power consumption for future time periods. Forecasts are validated against actual consumption data to assess the models predictive accuracy and reliability. Sensitivity analysis is performed to evaluate the robustness of the forecasts to changes in input variables.
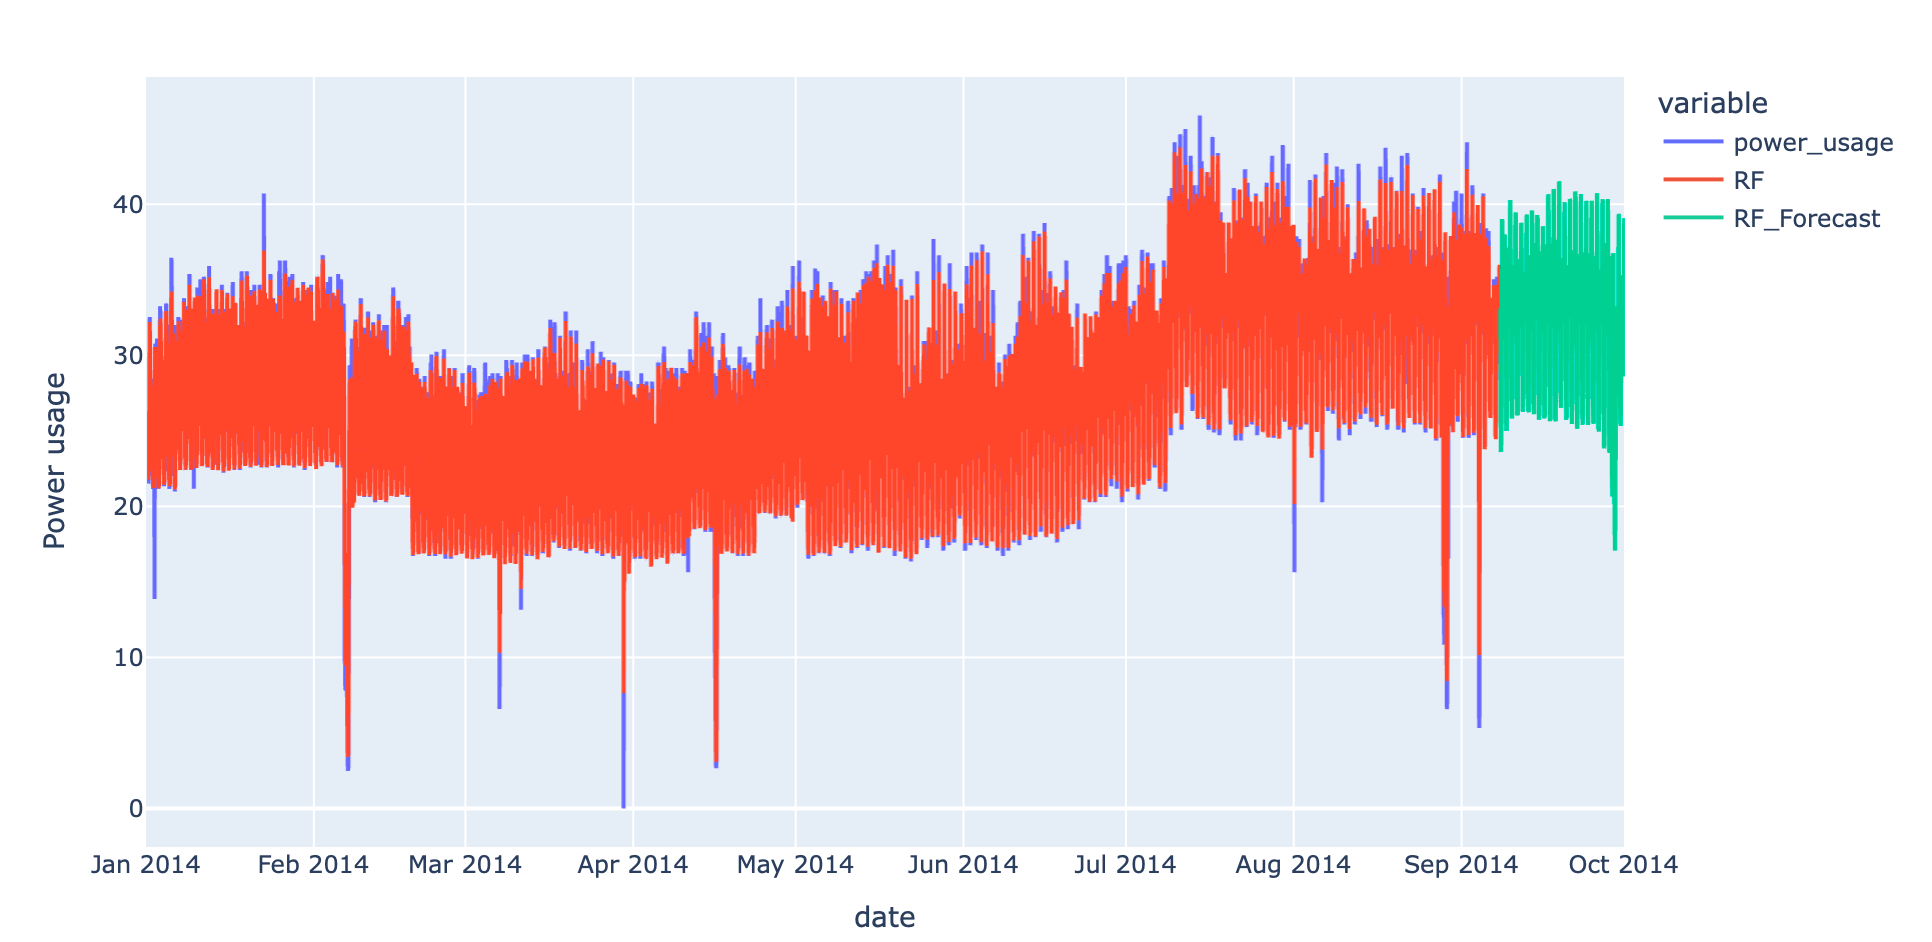
The forecasting models demonstrate robust performance, accurately predicting electric power consumption across different time horizons. Insights gained from the analysis highlight the impact of seasonal variations and consumer behaviour on power consumption patterns. Recommendations are provided to energy providers for optimizing resource allocation, implementing demand-side management strategies, and improving grid reliability.
Explainability
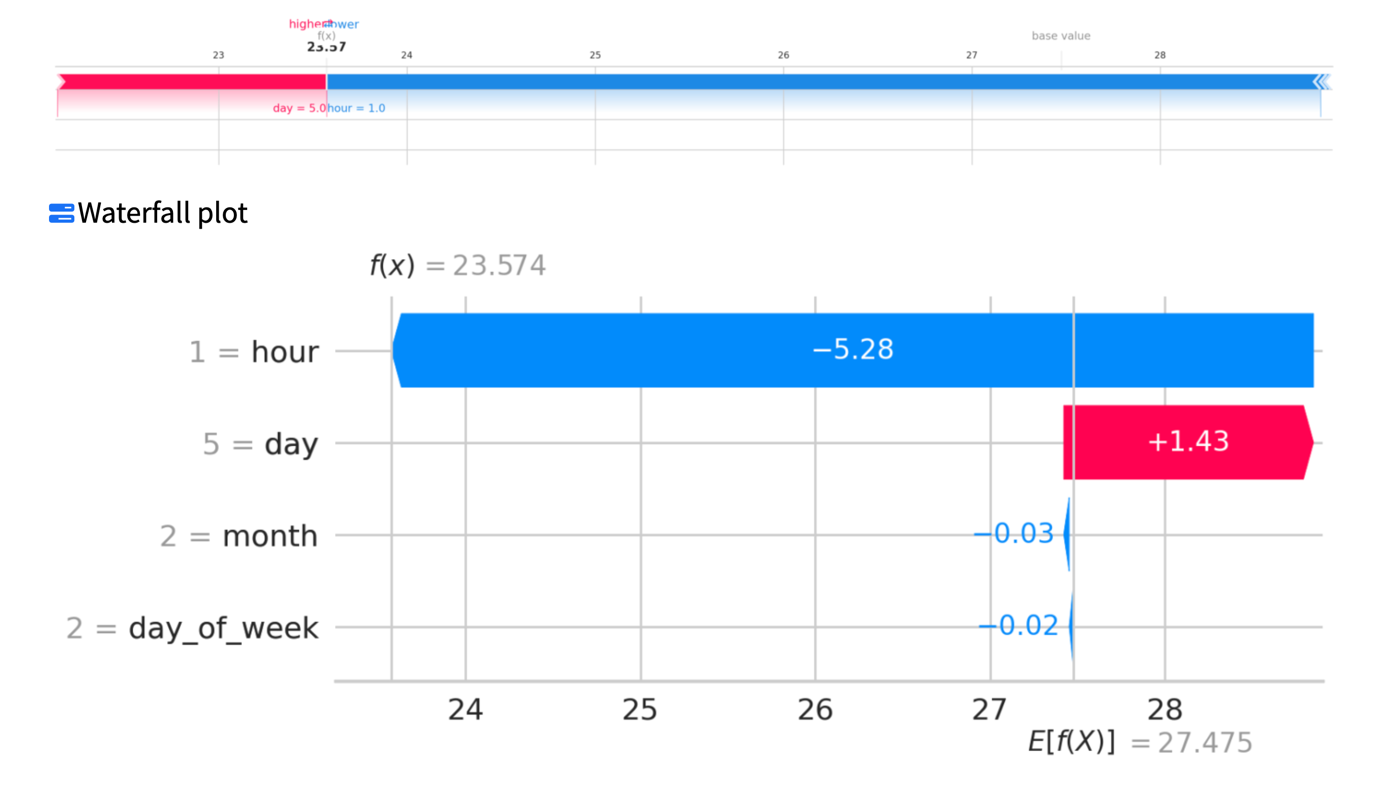
Since we have utilized regression models for forecasting power consumption, we can calculate SHAP values to get the interpretability of the model. By looking at the global SHAP values hour and month are the important features in forecasting power usage of a consumer. To get the individual or local level explainability one can plot waterfall plot. For the waterfall plot the example date and time given was 5th February at 1am in the midnight. The model predicted the power consumption to be less than average. The main reason is because of the time of the day.
Conclusion
In conclusion, leveraging the Kaggle Electric Power Consumption dataset, we successfully developed forecasting models that provide valuable insights for energy providers. These models enable proactive decision-making, enhance resource management efficiency, and contribute to the overall sustainability of the electric power sector. The case study demonstrates the importance of data-driven approaches in addressing complex challenges in energy forecasting and management.
Contact Us
Your response has been saved. Thank you.
We will reach out to you shortly.

Read More
See the latest of our technologies in our blog section.
The Hidden Costs of LLM APIs That Per-Token Pricing Doesn’t Tell You
This article is part of a series on buildi ...
How We Unified Three LLM Providers Behind One Interface
This article is part of a series on buildi ...
Your LLM Prompt Won’t Save You From This
This article is part of a series on buildi ...

© 2026 krtrimaIQ Cognitive Solutions. All Rights Reserved
Email: info@krtrimaiq.ai